HOW DOES THE UK STACK UP AGAINST OTHER EXPORTERS IN THE US MARKET?
BRIEFING PAPER 85 – JUNE 2025
MATTIA DI UBALDO AND ANUPAMA SEN[1]
Download Briefing Paper 85
KEY POINTS
- The UK’s trading position with the US is potentially more favourable than that of other major exporters like the EU, China, Japan, India, and South Korea.
- We carefully inspect data on trade between the US and its major partners, to assess the position of the UK as an exporter to the US from various angles.
- We compute an index of competitive pressure faced by the UK by third countries in the US, both on aggregate and in 2-digit HS chapters.
- We also inspect the competitors of the UK in the 50 products (at the 6-digit level) with the largest shares of UK exports to the US.
- The main competitor of the UK is the EU, both overall and in specific sectors and products. Other large countries exert pressure in specific sectors (e.g. China in plastics, articles of iron and steel, and electrical machinery).
- We also explore patterns of trade dependence between the UK and the US, and between the EU and the US.
- The UK is found to depend on the US as an export destination more than US relies on the UK as a supplier, and there is little co-dependence between these two economies.
- A stronger co-dependence is found between the EU and the US. In addition, the US depends substantially on the EU as a supplier, but the EU does not depend on the US as an export destination.
- Should the UK’s more favourable access to the US compared to the EU (its main competitor) crystallize over the next months and years, we identify over 500 products that could lead to export growth opportunities for the UK, mainly at the expense of the EU.
INTRODUCTION
Since President Trump took office in January 2025, uncertainty regarding doing business with the US has reached unprecedented levels. Firms have had to navigate an increasingly chaotic scenario characterised by tariff announcements, postponements, applications, sudden U-turns, court rulings and over-rulings. The severity of this uncertainty is compounded by the relevance of the US as a market for both the largest world exporters (the EU, China, India, Japan), as well as many smaller economies that depend on the US as an export destination. Hence, the negative repercussions of the protectionist turn taken by the US will extend far beyond US firms and consumers and will likely put downward pressure on economic activity globally.
This also applies to UK firms, both directly and indirectly. In this briefing paper we examine the position of the UK as an exporter to the US vis-à-vis that of its main competitors. We begin by summarising the main tariff-events that affected the UK. We then describe the degree of competitive pressure faced by UK firms in the US from other major exporters. Next, we take a closer look at the UK-US trade relation to identify patterns of trade dependence (on the US for UK exporters, and on the UK for US importer) and compare the latter to analogous patters for the EU-US relation. Finally, we identify a long list of products where, in case trading conditions with the US resulted substantially more favourable for UK relative to EU firms, there is scope for the UK to potentially expand its activity in the US.
A SUMMARY OF THE RECENT TARIFF EVENTS
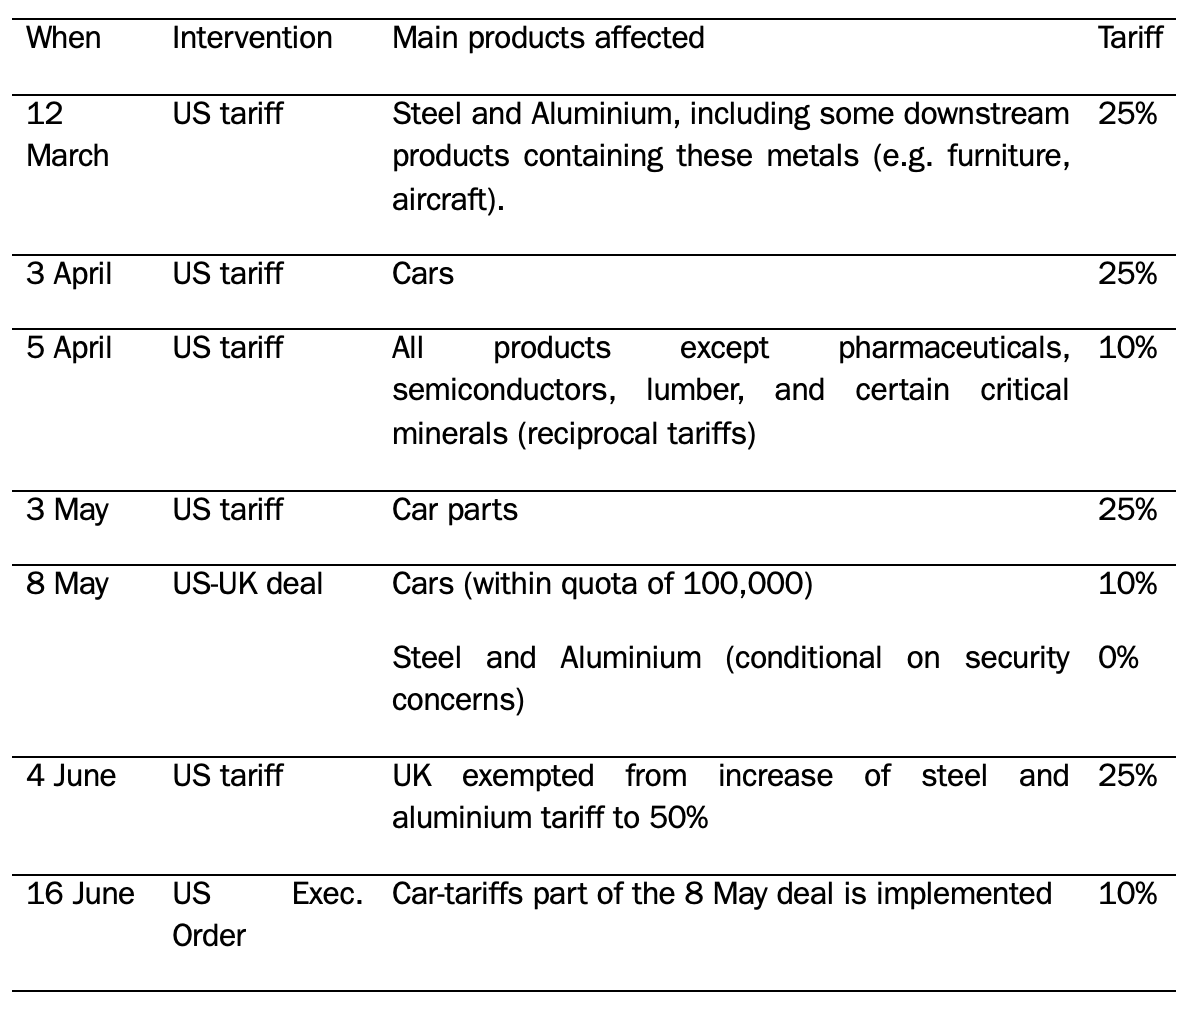
The most dramatic tariff interventions by President Trump affecting the UK are presented in Table 1.
Table 1: Key tariff events affecting UK exports to the US
Source: authors’ elaboration
Despite the tariffs increases suffered, the UK has been spared the substantially higher tariffs applied to other countries.
- The ‘reciprocal tariff’ applied on the UK is the baseline rate of “only” 10%, which is applied universally on all countries. The main international exporters to the US market (e.g. the EU, China, India, Japan, South Korea, Switzerland) were hit with higher rates ranging from 20% (the EU), to 34% (Switzerland). Any tariffs exceeding the 10% rate have been paused for 3 months from April 9 (effectively, they were never applied), but they might be applied in the absence of trade deals to be concluded before the deadline of July 9. Several countries are currently negotiating with the US to reach such a deal (e.g., the EU, Japan, India).
- The UK has been the first country to sign a deal with the US to reduce some of the tariffs listed in Table 1. However, the Economic Prosperity Deal is not a legally binding document, and negotiations appear to be on going. Nevertheless, the Executive Order of June 16 implements the lower tariffs on cars, which fell to the baseline 10%. Tariffs on steel and aluminium have not yet been lowered to the level agreed in the May 8 deal.
- Thanks to its May 8 deal, the UK was also spared the increase in US steel and aluminium tariffs to 50% affecting all (other) countries, and that came into effect on June 4.
Doing business with the US has become substantially more onerous due to the inability of firms to plan their production and investment in an accurate way. However, the US retains its attractiveness as the largest economy in the world, and the substantial heterogeneity in the (threatened and applied) tariff rates might create some exporting opportunities. The UK’s terms of trade with the US have worsened with respect to the pre-Trump 2.0 era but, so far, its position looks potentially more favourable than that of other countries. Should the events and negotiations unfolding in the coming months crystallize this advantage for the UK, a question arises: who are the main competitors of the UK in the US market over which this advantage may play out?
THE POSITION OF THE UK AMONG EXPORTERS TO THE US
The US is the most important export destination for UK firms, after the EU. In 2023, out of a total value of goods exports of $471 billion, $60.09 billion (12.75%) were shipped to the US. Table 2 shows, however, that the UK is only the ninth largest goods exporter to the US, which suggests that UK firms face substantial competition in that market.
Table 2: top 10 exporters to the US
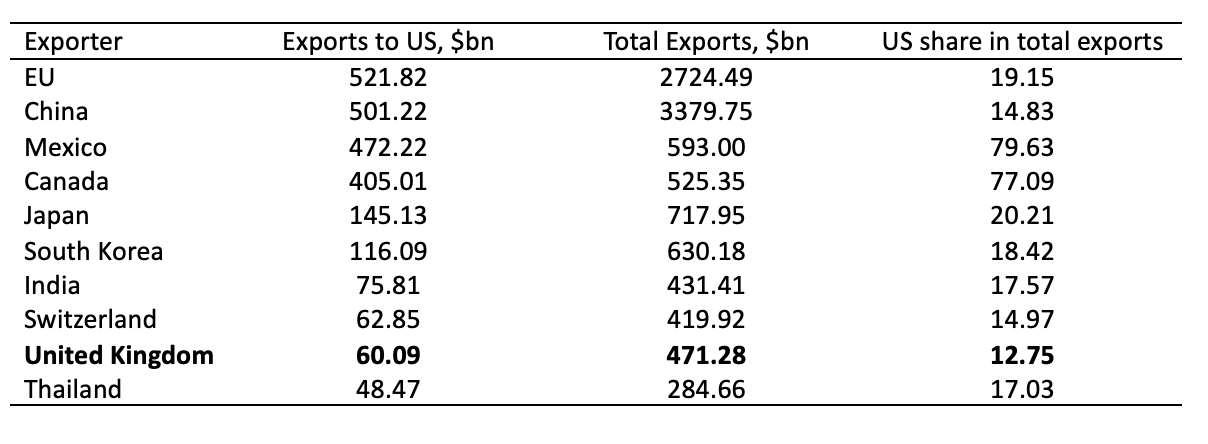 Note: Source: author’s elaboration on data from WITS for 2023.
An aggregate view of UK’s competition in the US
To examine more accurately the position of the UK as an exporter to the US, vis-à-vis that of other countries, we exploit the Relative Export Competitive Pressure Index (RECPI), originally developed by Winters et al. (2009). Formally, the index is computed as follows:
The index captures the degree of competitive pressure exerted by country j on country i in a third market (the US, in this case), where i denotes the reporter country (the UK, in this case), j the competitor country, k denotes the product. denotes the share of product k in country i’s exports to the US; denotes the value of country i’s exports of product k to the US; denotes the value of the competitor’s country j’s exports of product k to the US.
The denominator combines information on the reporter country’s export structure (the shares) with the level of exports of each product, and can be interpreted as a weighted average of i’s exports to the US. The numerator is also a weighted average, but where the reporter country’s export structure is applied to the competitor’s level of exports. The index can take value:
- 0, if i and j export different products to the US and do not compete with each other;
- 1, if i’s and j’s export structure and levels of exports to the US are identical;
- positive values if there is overlap in the exports of country i and j to the US.
The index in unbounded upwards, i.e. it can take increasingly larger values the larger the level of exports of the competitor, and/or the more the competitor’s exports are skewed towards products with higher shares for the reporter country (i.e. the products which, for the reporter, account for a larger share of total exports to the third country). For example, if the EU’s and the UK’s composition of exports to the US is exactly the same, but the EU exports more than the UK, the index will be larger than 1. Or, if the UK’s and Switzerland’s level of exports to the US is the same, but Switzerland’s trade is more concentrated in the products that have high export shares for the UK, then the index will be larger than 1. Hence the index captures competitive pressure on the basis of both the level of trade and the composition of trade.
Note, finally, that the index is not symmetric, i.e. country j can be a strong competitor for country i, but the opposite must not be true. To simplify things, we can loosely interpret values larger than 1 as cases where, given the reporter’s export structure, the reporter is “outperformed” by its competitor. Similarly, values between 0 and 1 imply that, given the reporter’s export structure, the reporter sells more than the competitor.
Overall, note that the forces that drive international trade from a “gravity” point of view[2] (i.e. market size, cultural and geographical proximity) will also have an influence on the index (larger and closer markets are likely to be tougher competitors). However, since the relationship summarized by the RECPI index is trilateral rather than bilateral, and the index also considers the structure of trade, the gravity setting cannot directly be applied to explain all the results provided by the RECPI index.
We compute the RECPI for the UK as a reporter country with data from WITS on exports to the US at the HS 6-digit level for 2023. Table 3 reports the 15 strongest competitors of the UK in the US. We note a few interesting features: 1) the EU strongly outcompetes the UK; 2) we find a RECPI>1 for only four countries, with the notable exclusions of China, India, Japan, and South Korea. From Table 1 we know that these countries export considerably more than the UK. Hence a RECPI less than one, in turn means that the composition of these countries trade with the US is somewhat different to the of the UK, with comparatively little overlap between their export structures and that of the UK; 3) the RECPI index rapidly decreases after the first few countries, and the overall average of 0.132 places the UK among the most competitive exporters serving the US.
Table 3: Top 15 competitors of the UK in the US
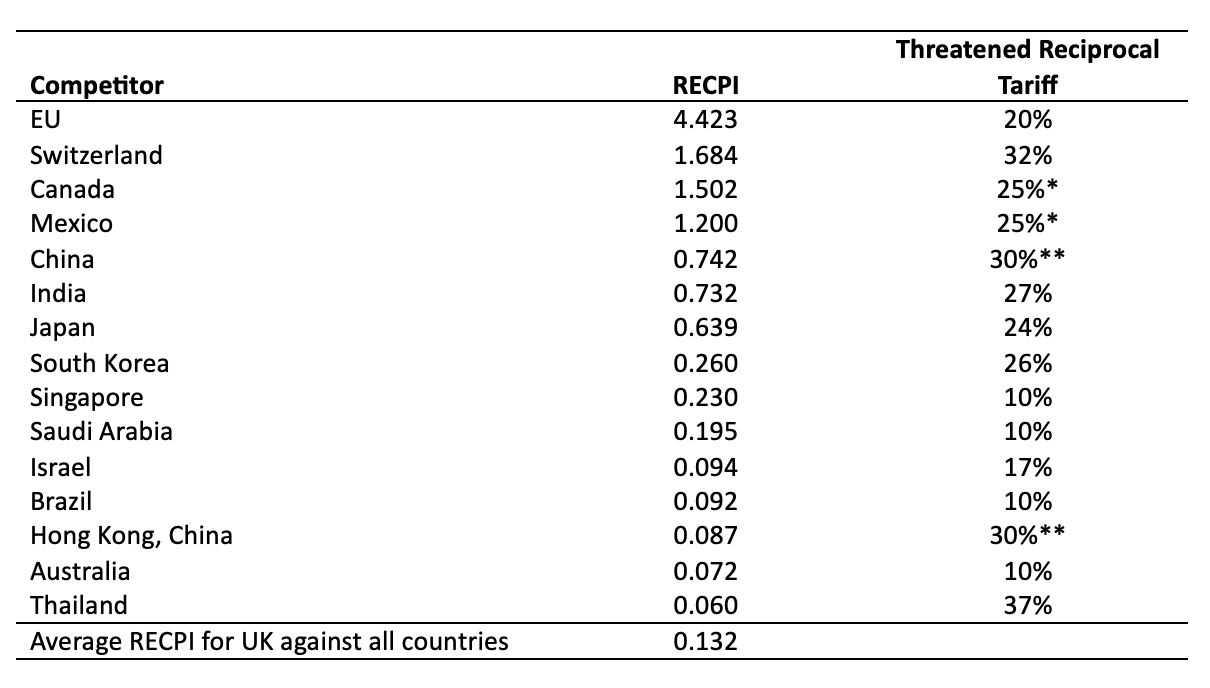
Note: the average RECPI for the UK is computed across all exporters to the US, not only the top 15 competitors. Currently, reciprocal tariff rates in excess of 10% are paused for 90 days.*Canada and Mexico are not subject to reciprocal tariffs, and we report the tariffs on imposed March 4th. Furthermore, Canadian and Mexican goods satisfying the USMCA rules of origin are exempt from the tariffs. **China’s reciprocal tariffs were initially set at 34%, in addition to other tariffs already applied; the tariff war that followed saw the tariffs increasing to 145% and then falling to 30% after an agreement to pause the tariff war. Source: author’s elaboration on data from WITS for 2023.
The RECPI reported in Table 3 is computed across all products, and therefore represent an average level of competitive pressure. Substantial heterogeneity generally hides behind aggregate figures. Hence, we re-compute the RECPI separately by 2-digit HS chapters and, in Figure 1 and 2, we plot the RECPI of the 15 HS chapters with the largest shares of UK exports to the US computed vis-a-vis the 8 top competitors of the UK (as listed in Table 2). Figure 1 shows the entire spectrum of values taken by the index, while Figure 2 focuses on the values between 0 and 2, to allow to visualise more easily where competition for the UK is relatively weaker.
Figure 1: RECPI by 15 largest UK export chapters vis-à-vis top 8 competitors
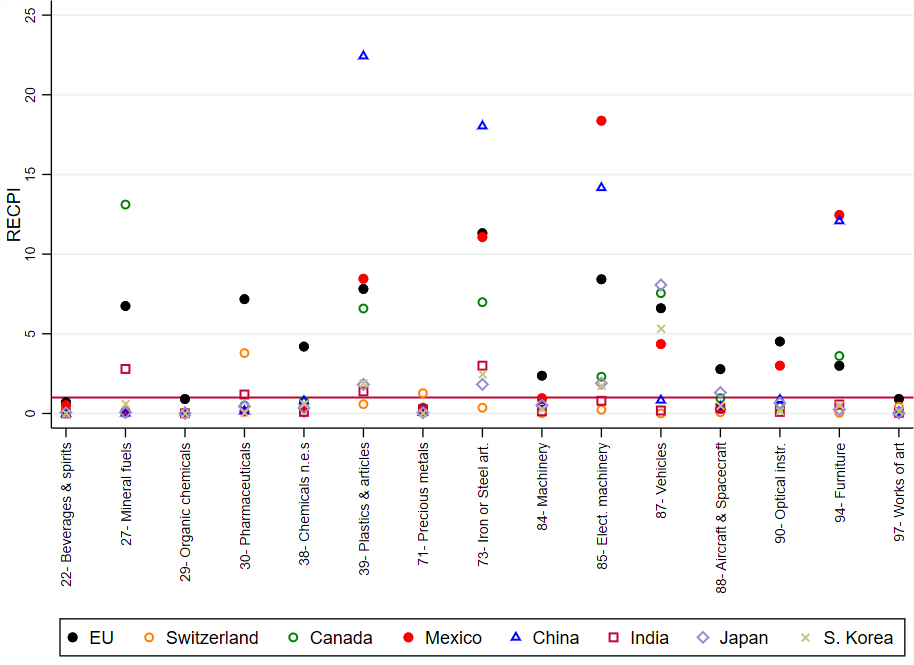
Source: author’s elaboration with data from WITS for 2023.
Figure 2: RECPI by 15 top UK export chapters vis-à-vis top 8 competitors – 0<RECPI<2
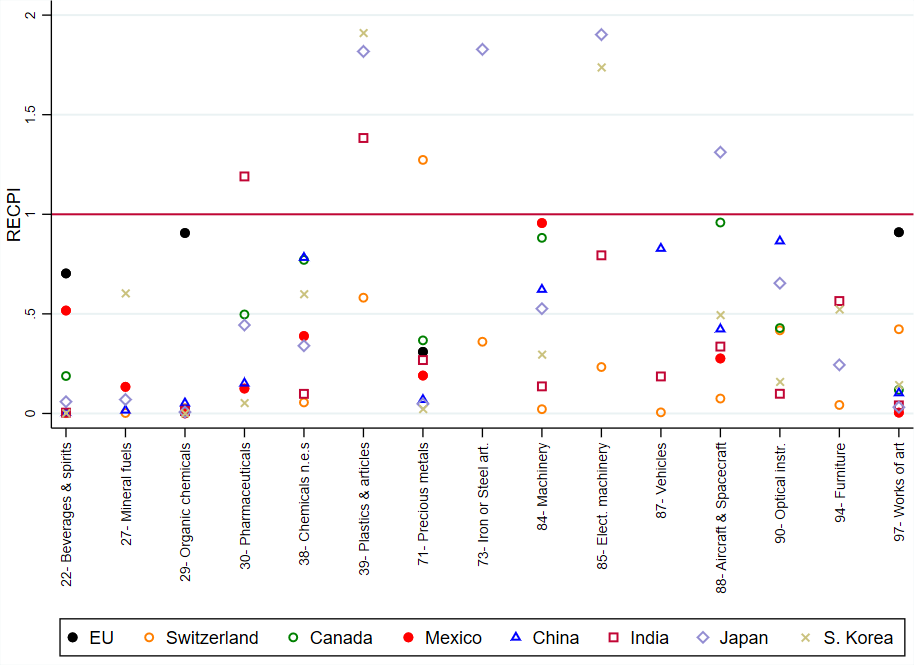
Source: author’s elaboration with data from WITS for 2023.
Again, we note a few interesting patterns:
- No country outcompetes the UK in beverages and spirits, organic chemicals, and works of art.
- The EU is a strong competitor of the UK in almost every chapter, except precious metals.
- Only the EU outcompetes the UK in machinery (chapter 84), which is the chapter accounting for the largest fraction of UK exports to the US (21% of the total).
- China vastly outcompetes the UK in 4 out of 15 chapters (plastics, articles of iron and steel), but exerts much lower pressure in the rest of the products, resulting in a modest competitive pressure on average.
- India and South Korea are not strong competitors to the UK in a large majority of chapters.
- Switzerland’s competitiveness rests on pharmaceuticals and precious metals.
A detailed product-level view
An alternative way of examining the position of the UK in the US is to look at which products the UK exports to the US the most, and which countries are the main UK competitors for each product. For the latter we examine which countries are the top exporters to the US. This is presented in Table 4.
With data from WITS, we extracted the 50 HS-6 digit level products with the largest shares of total UK exports to the US. For each product, we report the top-exporter to the US, the US MFN tariff, the share in total UK exports to the US, the rank of the UK as its exporter to the US, and if the product has been excluded from any reciprocal tariffs. Taken together, these products account for about 58% of all UK exports to the US, a notable figure, considering that the UK exports over 4,300 different products to this country. Out of these 50 products, the UK is the top exporter to the US for 13 of them, and for 12 it is the second-largest exporter. Overall, the UK is among the top-5 exporters in 36 out of 50 products.
Looking at the competitors, we note that the EU is by far the strongest one, as it is the top exporter for 19 products (in many of which the UK is the second- or third-largest exporter). The second-strongest competitor is Mexico (6 products as top exporter), followed by China (4 products), and Canada (2 products).
Table 4: top 50 products exported by the UK to the US
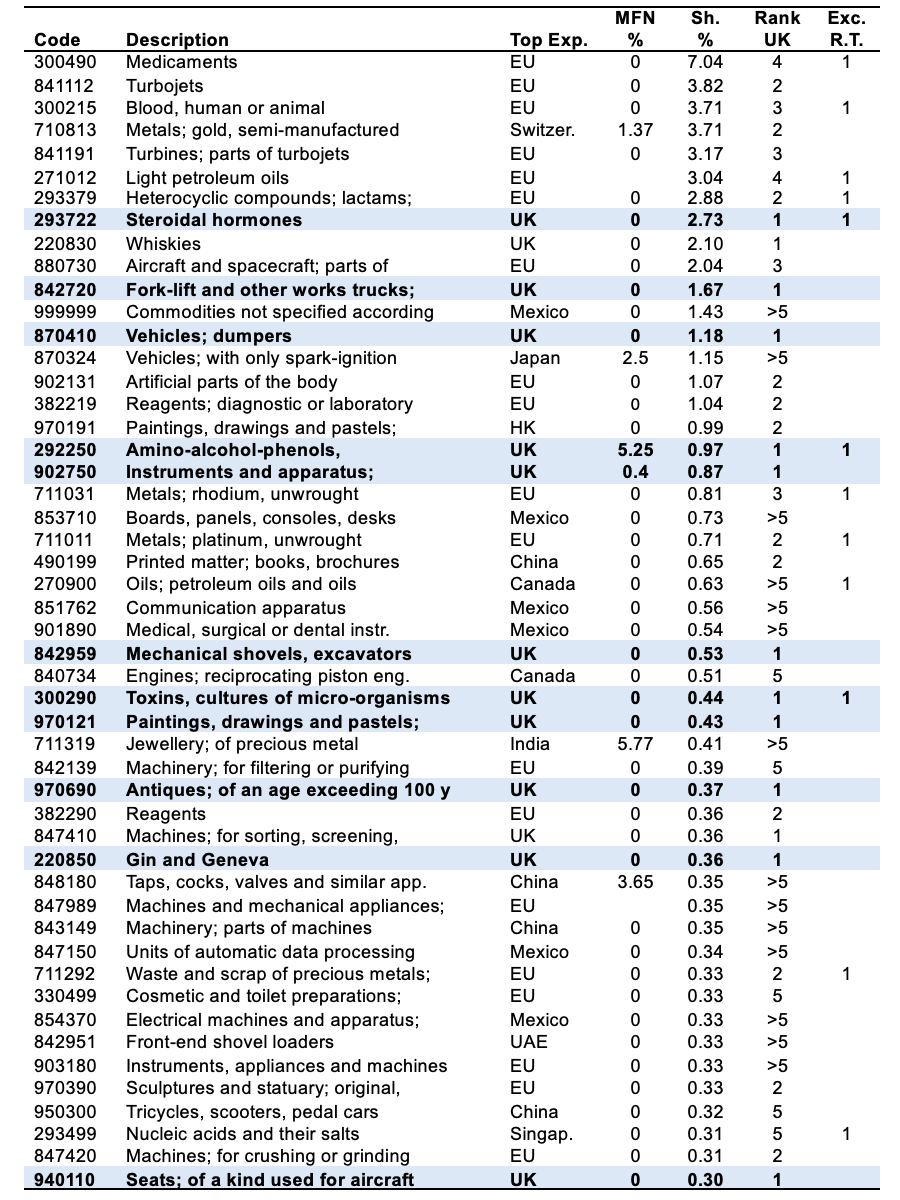
Source: authors’ elaboration on data from WITS and US ITC. Note: products 271012 and 847989 face a mix of ad-valorem and specific duties at lower levels of disaggregation (8 and 10 digit), such that a simple MFN rate for the 6-digit group could not easily be attributed.
TRADE DEPENDENCIES AND EXPANSION OPPORTUNITIES FOR THE UK[3]
Having identified the EU as the main competitor of the UK in the US market, in this section we present a complementary set of figures which unveil patterns of trade dependence/independence at the product level, between the UK and the US on the one hand, and the EU and the US on the other. The focus on these two bilateral trade relationships helps us identify products which could present growth opportunities for the UK should its main competitor end up facing worse trading conditions in the US.
UK-US trade dependence
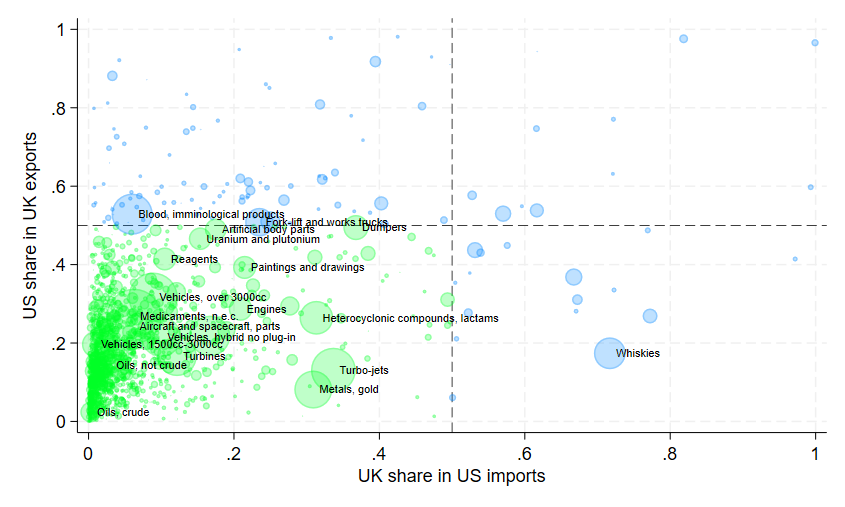
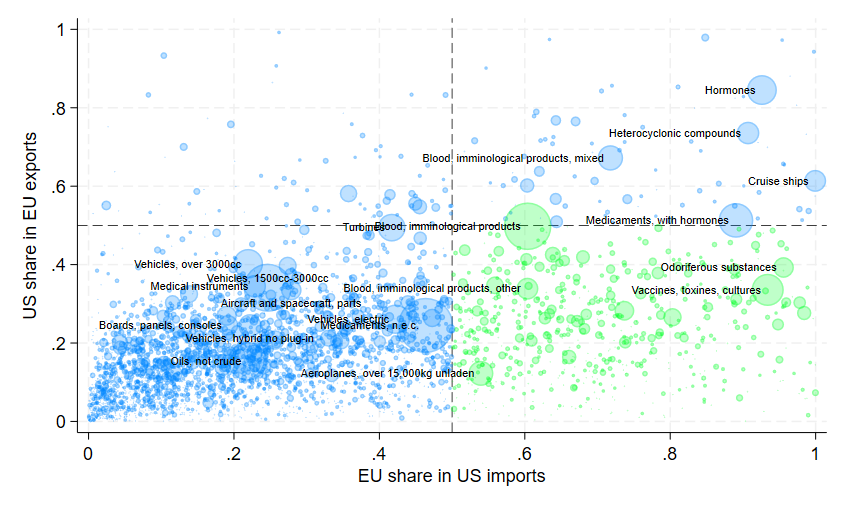
In Figure 3 we plot two product-level (HS-6 digit) shares against each other. The share of UK exports of a product that go to the US along the y-axis, and the share of US imports of a product that originate from the UK along the x-axis. The size of each bubble is given by the value of US imports. We divide the chart into four quadrants.
- Top-left: These are products where the UK depends on the US market as a destination but where the US has alternative suppliers to the UK (we label this as the “US market-power quadrant”).
- Bottom-right. These are products for which the US depends on the UK as a source of imports but where the UK has alternative buyers to the US (we label this as the “UK market-power quadrant”).
- Top right: These are products for which the UK and the US depend on each other as a supplier and as a buyer (we label this as the “co-dependence quadrant”).
- Bottom-left: These are the products for which neither the UK nor the US depend on the other as a buyer or as a supplier (we label this as the “low dependence quadrant”).
To explain these definitions take these two examples: for “Whiskies”, in the “UK market-power” quadrant, about 70% of US imports originate from the UK, but less than 20% of UK exports are directed to the US. Hence, the US depends on the UK for this product, but not vice-versa. For “Blood, immunological products” in the “US market-power” quadrant, over 50% of UK exports go the US but less than 10% of US imports come from the UK. Hence, for this product the UK depends on the US, but not vice versa.
Figure 3: Trade-dependence patterns between the UK and the US
Source: author’s elaboration with data from BACI for 2023. Note, flows worth less than $1Million US imports are not reported.
Figure 4: Trade-dependence patterns between the EU and the US
Source: author’s elaboration with data from BACI for 2023. Note, flows worth less than $1Million US imports are not reported.
Figure 3 depicts a situation where there is larger number of products in the “US market-power quadrant” than the “UK-market power quadrant”, very few products in the co-dependence quadrant, and the majority of the products in the no-dependence quadrant. This is due to a) the US not being the main trade partner of the UK, and b) the US being substantially larger than the UK. So, in sum, there is little co-dependence, and the UK appears to depend on the US more than the other way around.
EU-US trade dependence
Figure 4 presents the analogous analysis for EU-US trade patterns. This relationship looks very different from the UK-US one. The largest number of products are again found in the no-dependence quadrant (bottom left), but the second most populated quadrant is the “EU-market power” one (bottom-right). Hence, the US depends on the EU substantially more than vice-versa (the EU depends on the US for a minority of relatively unimportant products – top-left quadrant). Note also the situation in the top-right quadrant indicating a number of products with very large import values for which the EU and the US co-depend: besides cruise-ships, it’s mostly pharmaceutical products and organic chemicals that tie EU exporters and US importers closely together.
Growth opportunities for the UK
Figures 3 and 4 can be used to identify export-growth opportunities for the UK, should the EU face worse market access in the US, compared to the UK. These opportunities could arise in products meeting jointly the following conditions:
- the UK does not depend on the US (low-US share in UK exports)
- the UK does not dominate the US market (low-UK share of US imports)
- the EU has large shares of the US market
- the EU does not depend on the US (low US share in EU exports)
The first two conditions identify products where there is space for UK exports to grow more easily, possibly by re-directing trade from alternative destinations. The latter two conditions identify products that EU exporters can more easily divert away from the US, and that could leave sizeable market shares available to for UK exporters to fill.
Graphically, such growth opportunities are represented by products in the overlap of the two green-coloured quadrants, i.e. products that are at the same time in the no-dependence quadrant in Figure 3, and in the EU market power quadrant in Figure 4. Out of 4550 products that the UK exports to the US, 4342 are in the no-dependence quadrant. Out of these, 558 are found to be products with EU market power in the US.
Figure 5: distribution of export-growth opportunities, top 20 HS 2-digit chapters
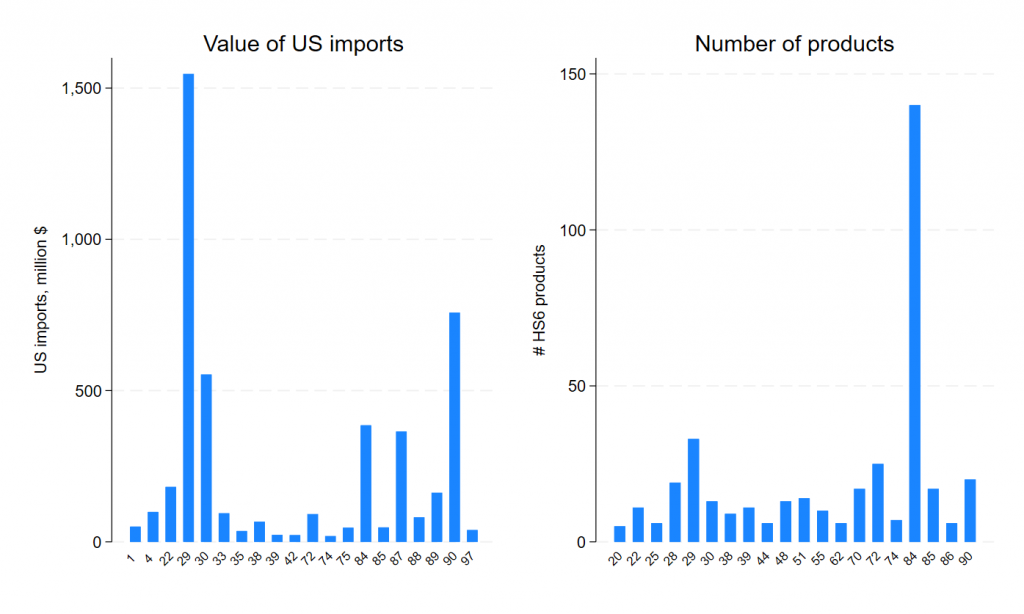
Source: author’s elaboration with data from BACI for 2023.
These 558 products are distributed across most of the HS-2 digit chapters (81 out of 97 in the classification), although Figure 5 shows that some interesting tendencies emerge in terms of the value of trade (US imports from the UK) and the number of HS-6 products in each of the chapters.[4] Organic chemicals (29), optical, photographic, measuring and medical instruments (90), and pharmaceuticals (30) top the ranking of the chapters including export-growth opportunities accounting for the largest value of trade (left-hand side of Figure 5). Nuclear reactors, boilers, and machinery (84) is the chapter where the largest number of growth opportunities are found (right-hand side of Figure 5).
Finally, to provide more detail, Table 5 lists the top 20 growth opportunities, ranked in terms of the current value of US imports from the UK. We report the overall rank of these products in among all US imports from the UK, the value imported, the share of the UK in US imports of that product, the share of the US in total UK exports of that product. On this list there are several organic chemicals, pharmaceutical and medical products, as well as vehicles (tractors, motorboats, helicopters, aeroplanes), and some food and drink products.
Table 5: Top 20 growth opportunities for the UK in the US, at the expense of the EU
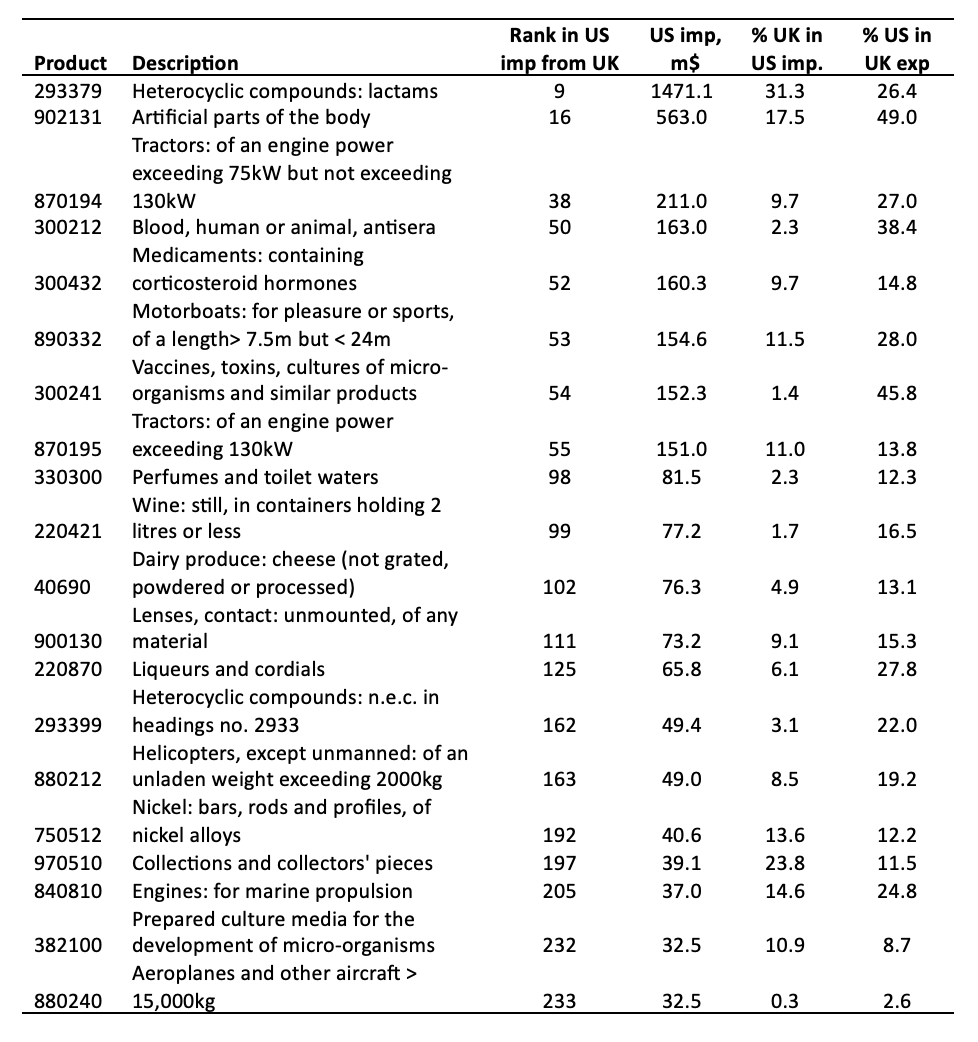
Source: authors’ elaboration on data from BACI for 2023.
CONCLUSION
What does all this mean in the context created by the reciprocal tariffs? Table 4 reveals a similar message to Table 3 and Figures 1 and 2 above. The UK is among the main exporters to the US, but on a much smaller scale compared to larger economies such as the EU and China, or closely connected countries like Mexico and Canada. There are some areas (e.g. beverages and spirits, organic chemicals) and a number of specific products distributed across various industries (chemicals, pharmaceuticals, machinery, art and antiques, vehicles) where the UK appears to have a competitive advantage. There is one exporter, the EU, which competes the most with the UK in the US market, i.e. it sells more of the products that constitute important exports for the UK. Other large exporters, like China, are not found to exert as much competitive pressure as the EU. However, pressure is very high in specific sectors such as plastics and articles of iron and steel.
Table 3 reports the reciprocal tariff rates that the US applied on the top 20 competitors of the UK in the US. Given that the UK has faced primarily only a 10% tariff increase, the US has effectively granted a large preferential margin to the UK over all its main competitors. To get a sense of the magnitude, consider that the preferential margin the EU offers to developing countries in its Standard GSP scheme is at most 3.5 percentage points. In contrast the UK can count on at least a 10-percentage point margin over the next least-tariffed exporter (considering the larger countries from the EU to South Korea shown in Table 3).
These tariffs have been paused for 90 days and the situation may yet change. For now, however, some UK firms have been given an advantage primarily over their EU competitors who are identified in this analysis as the UK’s closest and strongest adversaries in the US market.
If the EU does not negotiate a deal with the US in the coming weeks, the UK could potentially gain a longer-term advantage over EU firms. Out of the more than 4,000 products exported by the UK to the US, we have identified almost 600 where that competitive edge may be the greatest, and simpler, to achieve.
FOOTNOTES
[1] We thank Sahana Suraj for producing Table 4.
[2] This terminology is borrowed from the gravity model in the economics literature.
[3] In this section we use the BACI data from CEPII instead of WITS, because we examine trade patterns involving both exports and imports jointly. In BACI, discrepancies between imports and exports have been eliminated, facilitating the comparison of US imports and UK exports.
[4] Figure 5 reports figures for the top 20 HS chapters in terms of US imports and number of HS 6-digit products.